|
|
|||||||||||||||||||||||||||||||
|
|||||||||||||||||||||||||||||||
|
The Heart
Electrical
conduction
ECG
Waveforms
|
This page will I hope give you information and a better understanding of the ECG and cardiac relationships. More will be added when time permits. If there is anything you would like to see on this page let me know. Go to bottom of page to link back to LAS unofficial index. Click on thumbnails to left of page to open picture views.
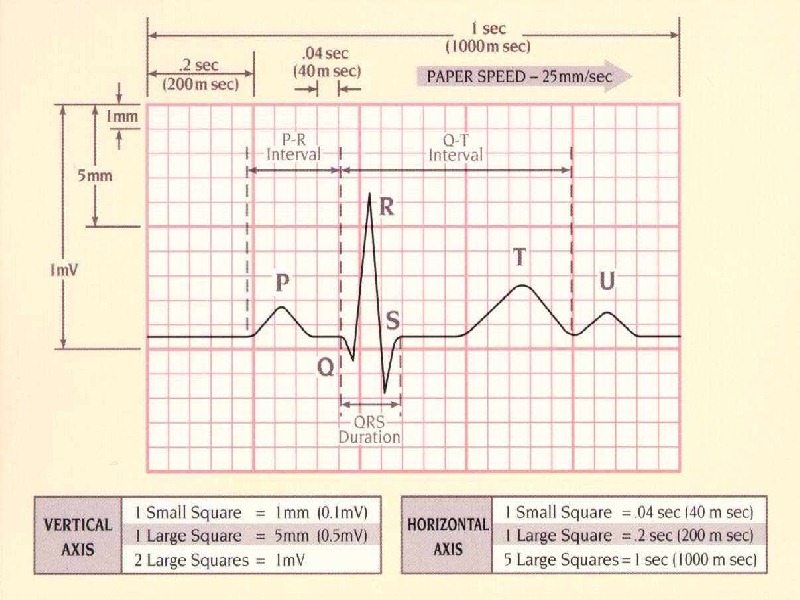
The baseline or isoelectric line This is represented as a straight line on the ECG paper where there is no positive or negative charges of electricity to create deflections.
These are representations of of electrical activity created by depolarization and repolarization of the atria and ventricles.If the electrical current is flowing towards the lead then a positive deflection will be seen. If flowing away from lead then a negative deflection will be seen. Wave forms that are above and below the Isoelectric line are called biphasic.
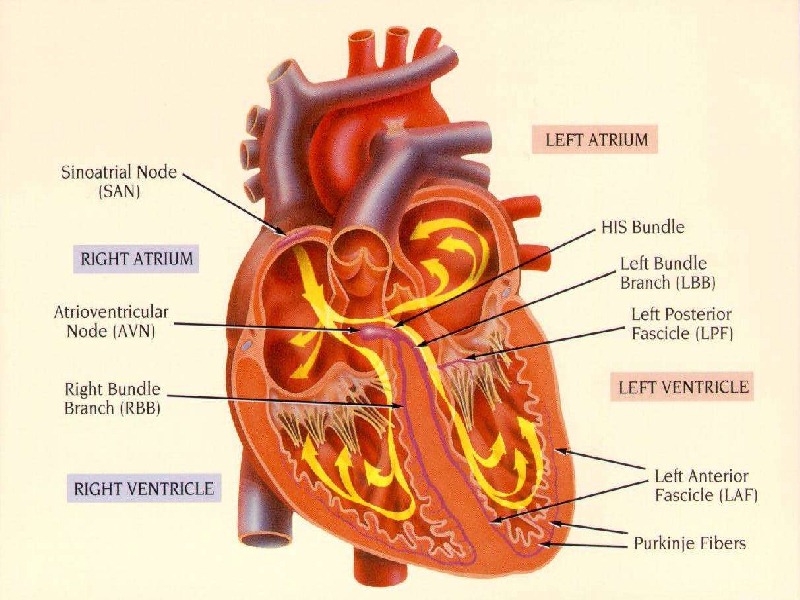
Electrical impulses originating in the SA node trigger atrial depolarization. The normal P wave is no more than 0.1 second in duration and 2.5mm high. The direction of electrical activity is from SA to AV node. The P wave is a representation of the time it takes for atrial depolarization. It is viewed normally as small and curved with a positive deflection. Seen at it's tallest on lead II.
Ventricular repolarization which follows ventricular depolarization, is represented by the T wave. Its shape is rounded and taller and wider than the P wave. It is also more sensitive to physiologic and hormonal changes in shape but usually presents as a positive deflection 5 -10mm in height.
After T wave an ECG can sometimes show a U Wave. It is of the same deflection as T Wave and similar to shape to P Wave. The U Wave is thought to represent late repolarization of the Purkinje fibers in the Ventricles and is more often not shown on a rhythm strip.
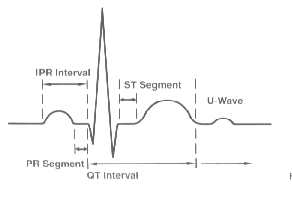
Interval refers to the length of a wave plus the isoelectric line that follows it. The length of an interval ends when another wave begins. They are named by using the letters of both waves on either side. Intervals contain waves. Segments refers to the baseline between the end of one wave and the beginning of the next wave. Segments are the lines between waves. See diagram below.
.
PR Interval Is the length along the baseline from the beginning of the P wave to the beginning of th QRS complex. This Is normally 0.12 to 2.0 seconds in duration. QT Interval Is the beginning of the QRS complex to the end of the T wave. In the presence of a U wave the measure should be from the beginning of the QRS complex to the end of the U wave. ST Segment Is the length between the end of the S wave of the QRS complex and the beginning of the T wave. It is electrically neutral. PR Segment It represents the delay in conduction from atrial depolarization to the beginning of ventricular depolarization. It is also electrically neutral.
The ECG has only one complex which is the QRS. it can be described as when one wave follows another without intervals, segments or isoelectric lines between them. The QRS complex represents ventricular depolarization. it consists of three waveforms. The normal complex begins with a downward deflection known as the Q wave, followed by an upward deflection called the R wave. The next downward deflection will be the S wave. All ventricular complexes are known as QRS complexes even if every wave is not present in all complexes. The normal QRS is 0.04 to 0.10 seconds. You may have also been told .08 to .11 the importance is minimal.
Estimating Rates and Rhythm RATE. Graph ECG paper is divided into vertical and horizontal lines. (see background example). small squares are 1mm sq. The larger squares are 5mm. The time or rate is estimated by measuring the number of square blocks along the horizontal line. The distance across one small square is 0.04 seconds. The distance across one large square (5 small squares) is 0.2 seconds. (0.04 x 5 = 0.2).The distance across 5 large squares is equal to 1 second (0.2 x 5 = 1.0). Vertical lines measure amplitude or voltage and is measured in millivolts. Each small square along the vertical line equates to .1 mV. One large square equals .5Mv
Horizontal lines measure time. Vertical lines measure voltage A one second strip consists of 5 large blocks, three seconds equates to 15, six second equates to 30.
Using the R waves ( or complexes ) Begin by counting the R waves in a six second strip. Multiply that number by 10 to determine the heart rate in one minute. For example if there were four R waves in a six second strip this would equate to 4 x 10 = 40 beats/min. Quick count Count the large blocks that fall between two R waves. Start by finding an R wave that falls on or close to a dark line.
Quick guide to estimating heart rate
Rhythm To determine a rhythm or pattern, you must measure the distances between complexes and compare this against the next grouping of complexes. This is done by measuring the distance between one P wave and the next P wave or from one R wave to the next. If the PP or RR intervals are consistent then the rhythm is normal or regular.
Go to Next page. Rhythm recognition
|
|
|||||||||||||||||||||||||||||